What do my Ovida communication metrics mean?
Last updated: May 24, 2026
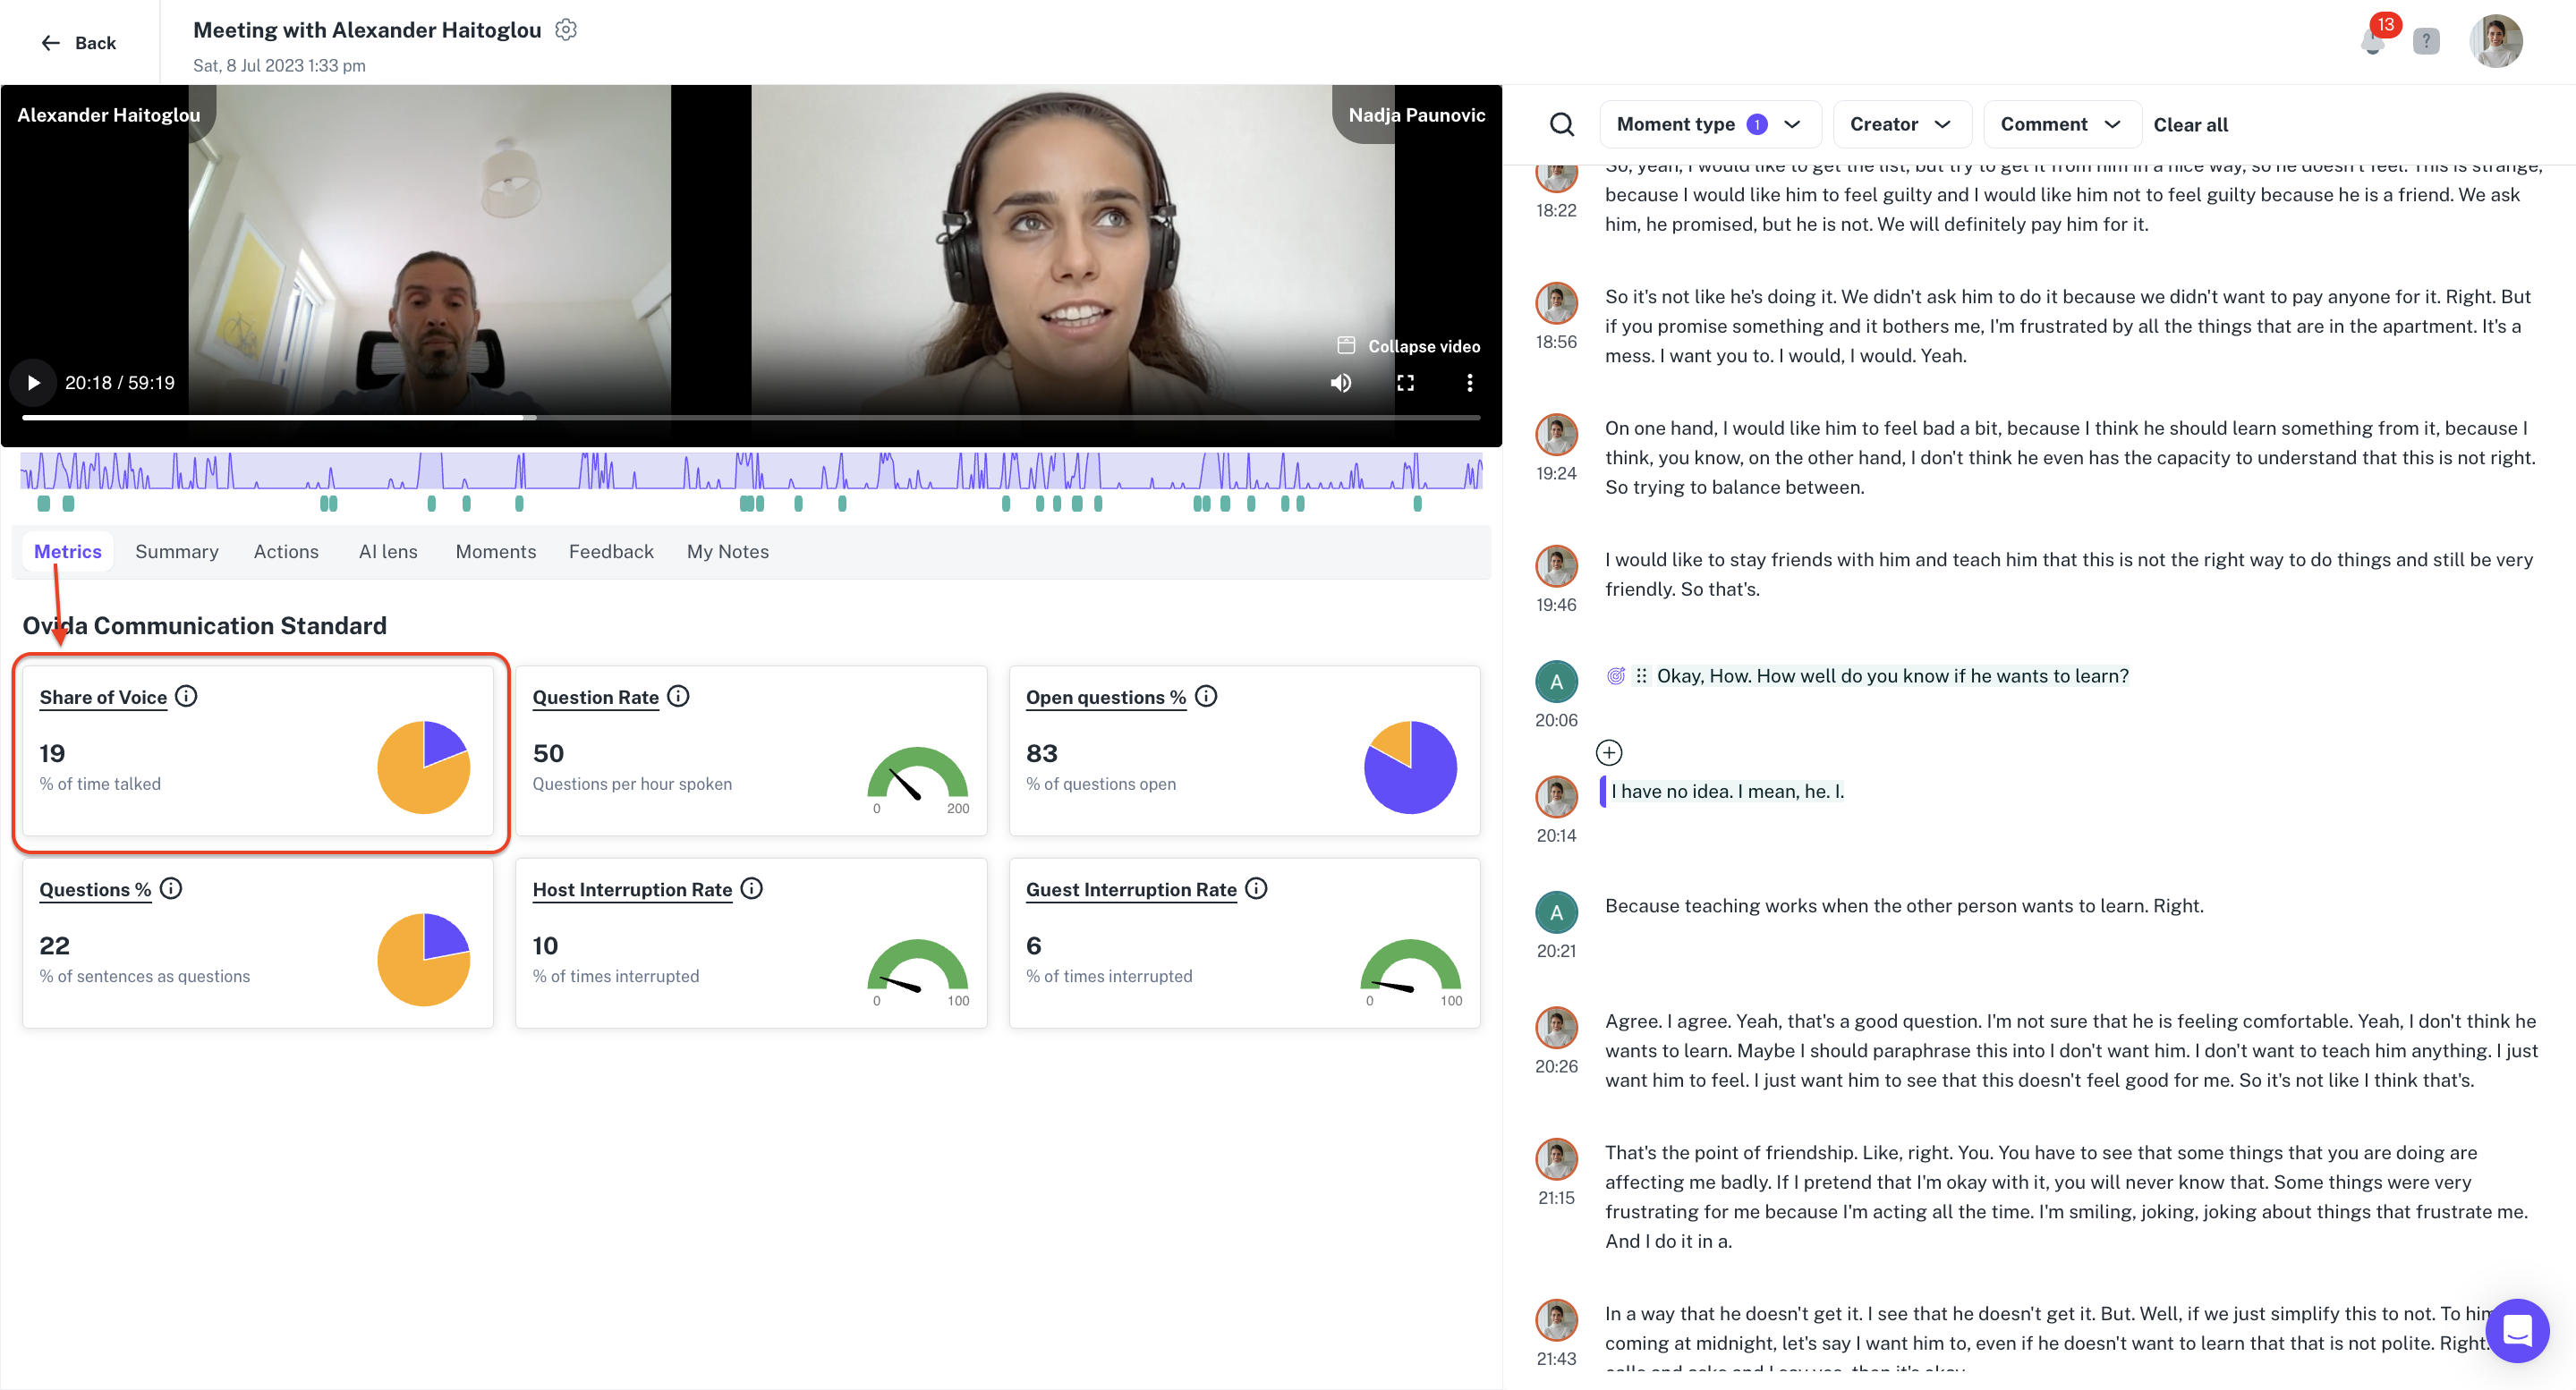
Ovida tracks five communication metrics from your meetings, all visible on your Metrics Dashboard. Each one captures a different aspect of how you communicate. Together they help you spot patterns and improve over time.
What makes these metrics trustworthy
Ovida's metrics are designed to be:
Consistent. Tracked the same way every time, so you can see progress over time.
Objective. Free from the bias that comes with self-assessment. (For example, our research shows people typically underestimate their own share of voice by as much as 25%.)
Meaningful. Tied to specific, observable communication behaviours.
Actionable. Directly linked to things you can change.
Share of voice
The percentage of speaking time taken by each person in the meeting.
This is the most fundamental measure of communication balance. The "right" share of voice depends on context:
Teaching, training, or giving feedback: above 50% is natural since you're leading
Job interviews: 10-20%, leaving space for the candidate
Collaborative meetings: closer to 50/50
Coaching or mentoring: 20-30%, leaving most of the space for the other person
There's no single "right" number. The ideal ratio shifts with the situation and your goals.
Question rate
The number of questions you ask per hour of speaking time.
This is a measure of engagement and how you guide a conversation. Our data shows that skilled communicators typically ask fewer than 50 questions per hour, focusing on clarity and timing rather than volume.
Too few questions may signal disinterest or create a one-sided conversation
Too many can overwhelm the other person or disrupt the natural flow
Open questions rate
The proportion of your questions that are open-ended.
Open questions can't be answered with a simple yes or no. They invite elaboration and often start with how, what, why, can you describe. (For more on the question types Ovida identifies, see the moment types article.)
A high ratio suggests a focus on exploration and understanding
A low ratio may suggest a tendency to lead conversations toward specific, closed responses
Questions as % of sentences
The proportion of your sentences that are questions rather than statements.
This is different from question rate. Question rate measures questions per hour. This metric measures the balance of questions versus statements within your speech.
Research suggests effective hosts and coaches maintain a ratio where questions make up around 20-40% of their total sentences. That range allows for exploration while still providing structure, feedback, and reflection.
Very high can come across as interrogative
Very low can lead to a one-sided conversation where the host dominates
Interruption rate
How often you and your guest interrupt each other. Host and guest rates are shown separately.
How interruption is counted:
An interruption is counted only when one person starts speaking and the original speaker stops. The interruption has to actually break the flow.
Talking over someone who keeps going isn't counted, it's conversational overlap, not interruption.
Filler words and encouragers like "uh," "umm," "aha," and "yes" are excluded.
A note on culture and context:
Interruption norms vary significantly across cultures. In high-context cultures (Japan, China, much of the Middle East), interruptions can be seen as disrespectful. In low-context cultures (United States, Germany, Australia), interruptions often signal engagement.
Personality and context matter too. A casual chat tolerates more interruption than a formal meeting. Being aware of who you're talking to is part of using this metric well.
How to use these metrics to improve
The metrics on their own don't change behaviour. The pattern that works for most users:
Review your recent meetings and look at the metrics together. Do you see patterns? Do you tend to dominate early? Drift into monologues? Stack questions?
Share recordings with a trusted colleague or mentor for outside feedback. Objective numbers paired with a human perspective is the fastest way to improve.
Try one adjustment at a time. Pick one metric and work on it across a few meetings. Trying to change everything at once rarely sticks.
Track your progress over time on the dashboard. Look for trends across many meetings, not single-meeting outliers.
Most users see measurable changes within a handful of intentional meetings. Improvement compounds when you keep at it.